用Pytorch搭建简单的Linear Regression

之前有一篇用 Numpy从零搭建Linear Regression。 想着可以简单的用Pytorch做一下,当然对于Pytorch来说有些大材小用了,一个feature, 一个output,就算是简单的学习了

Import library

1
2
3
4
5
import torch
import seaborn as sns
import matplotlib.pyplot as plt

%matplotlib inline

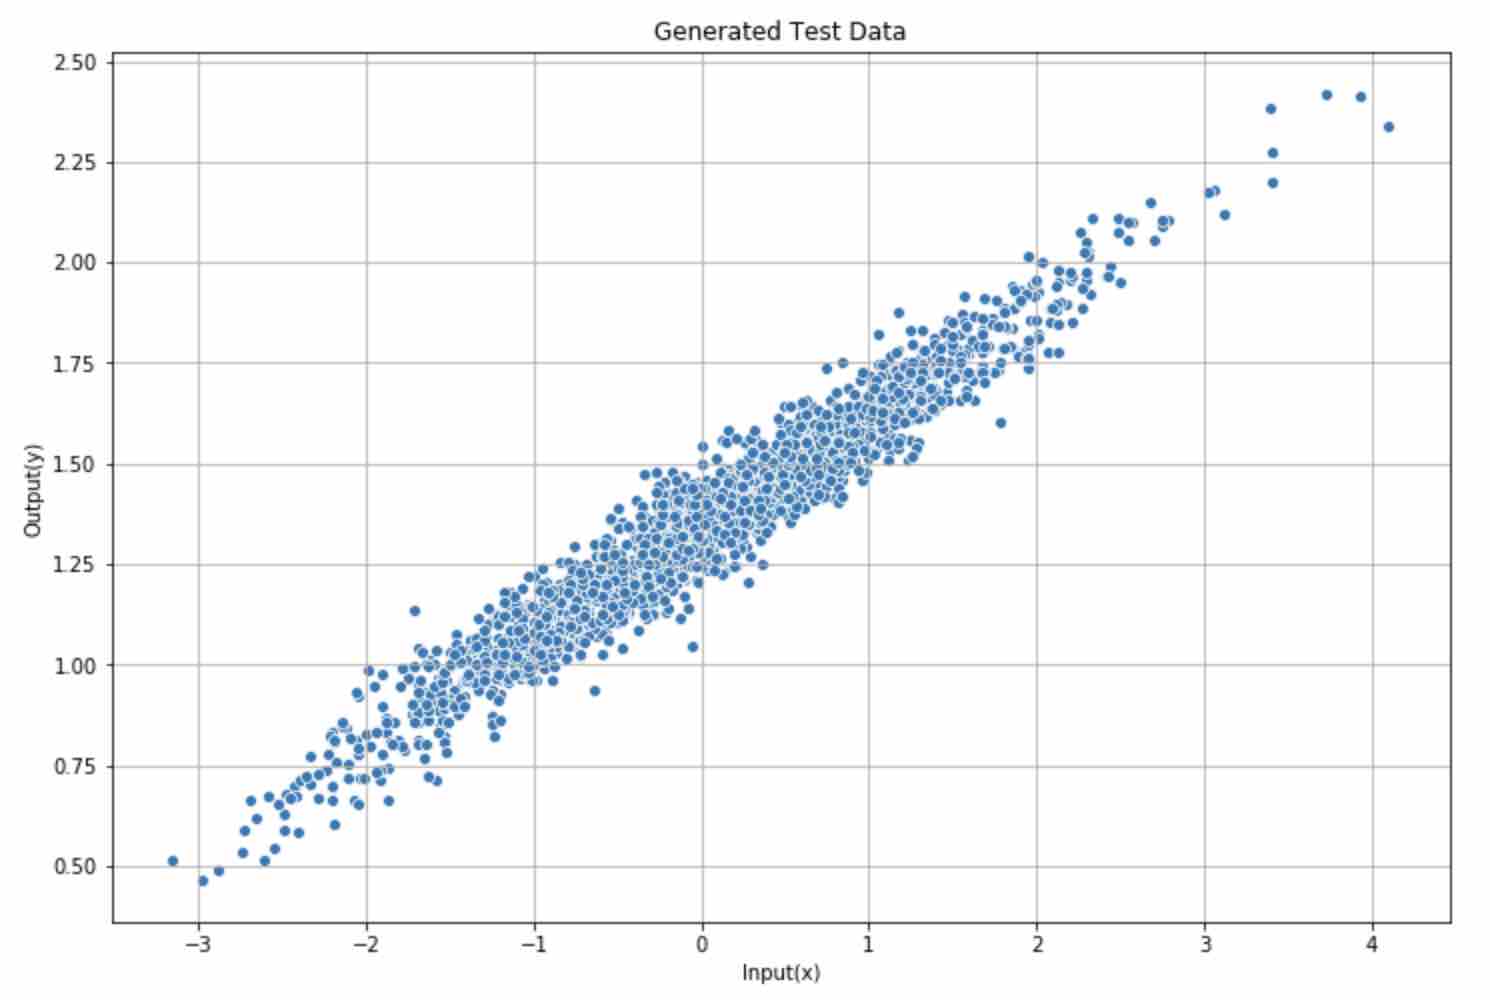
Generate test data

1
2
3
4
5
6
7
8
9
10
# 2000 samples with 1 input feature and 1 output
N, D_in, D_out = 2000,1, 1

torch.manual_seed(0)
x = torch.randn(N, D_in)
w = torch.randn(1).item()
b = torch.randn(1).item()
y = x * w + b + (torch.randn(N, D_in) * 0.07)
print('w ', w, 'b ', b)
# w  0.26755526661872864 b  1.3468186855316162

Plot generated data

1
2
3
4
5
6
7
plt.figure(figsize=(12,8))
plt.title('Generated Test Data')
plt.xlabel('Input(x)')
plt.ylabel('Output(y)')
sns.scatterplot(x=x.numpy()[:,0],y=y.numpy()[:,0])
plt.grid(True)
plt.show()

generated test data

Apply Linear model in Pytorch

1
2
3
4
5
6
model = torch.nn.Sequential(
    torch.nn.Linear(D_in, D_out)
)
loss_fn = torch.nn.MSELoss(reduction='sum')
learning_rate = 1e-3
optimizer = torch.optim.Adam(model.parameters(), lr=learning_rate)

Run model

1
2
3
4
5
6
7
8
9
10
11
12
13
14
15
16
17
cost = []
for t in range(100):
    y_pred = model(x)
    loss = loss_fn(y_pred, y)
    cost.append(loss.item())

    model.zero_grad()
    loss.backward()

    optimizer.step()

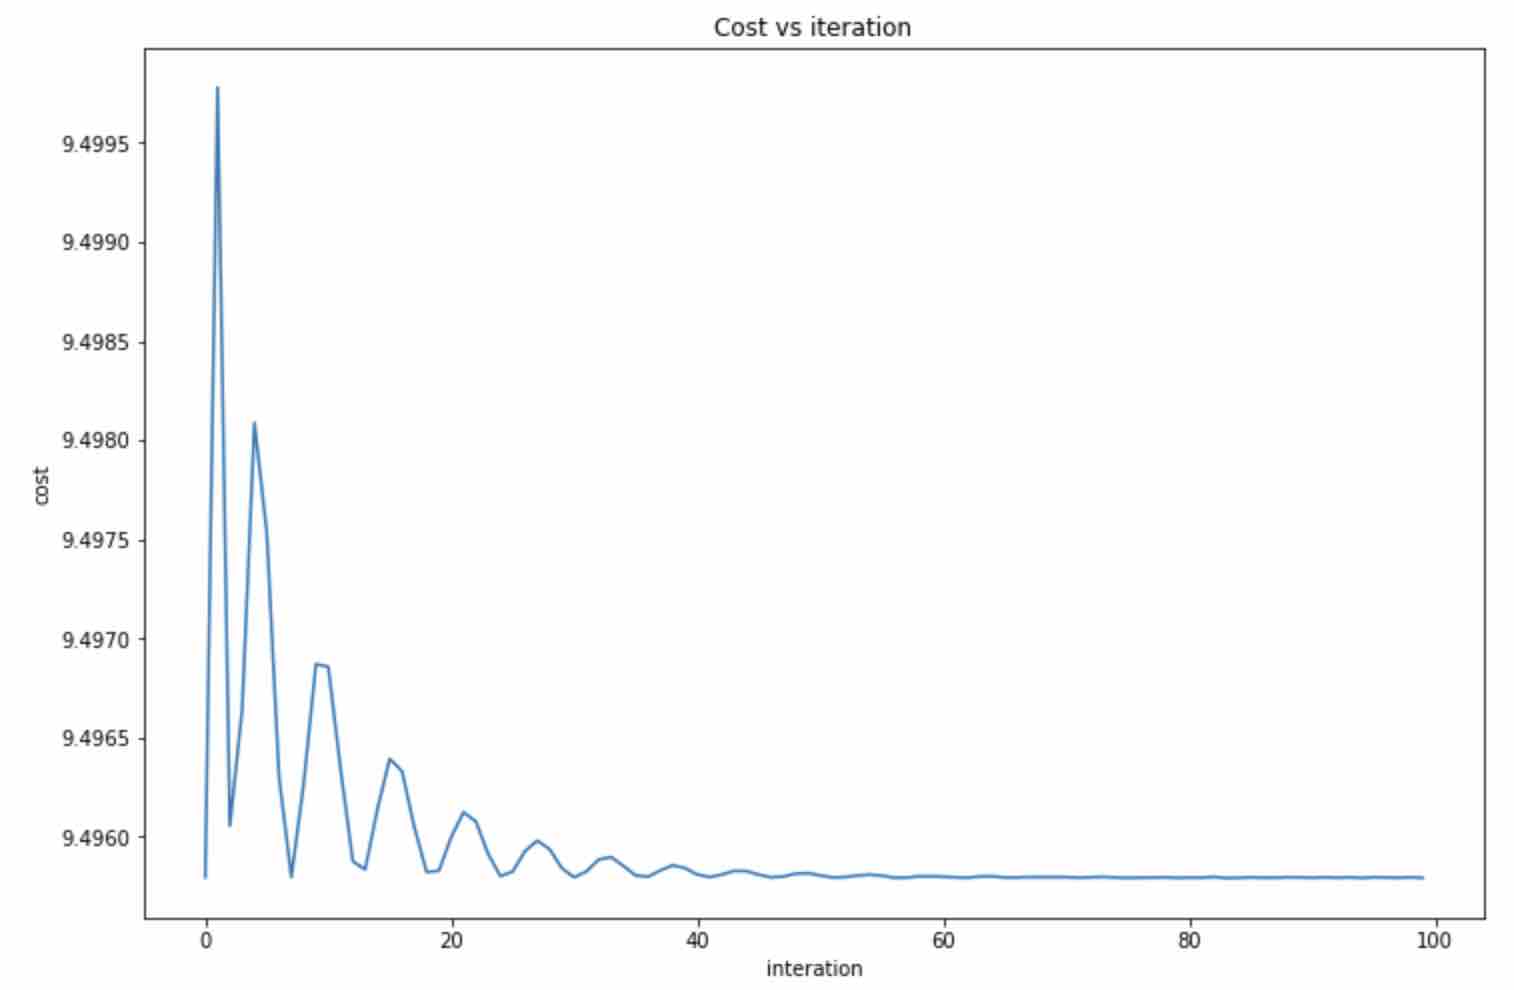
plt.figure(figsize=(12,8))
plt.title('Cost vs iteration')
plt.xlabel('interation')
plt.ylabel('cost')
plt.plot(cost)
plt.show()

cost_vs_iteration

1
2
3
4
5
6
list(model.parameters())

# [Parameter containing:
#  tensor([[0.2688]], requires_grad=True),
#  Parameter containing:
#  tensor([1.3452], requires_grad=True)]

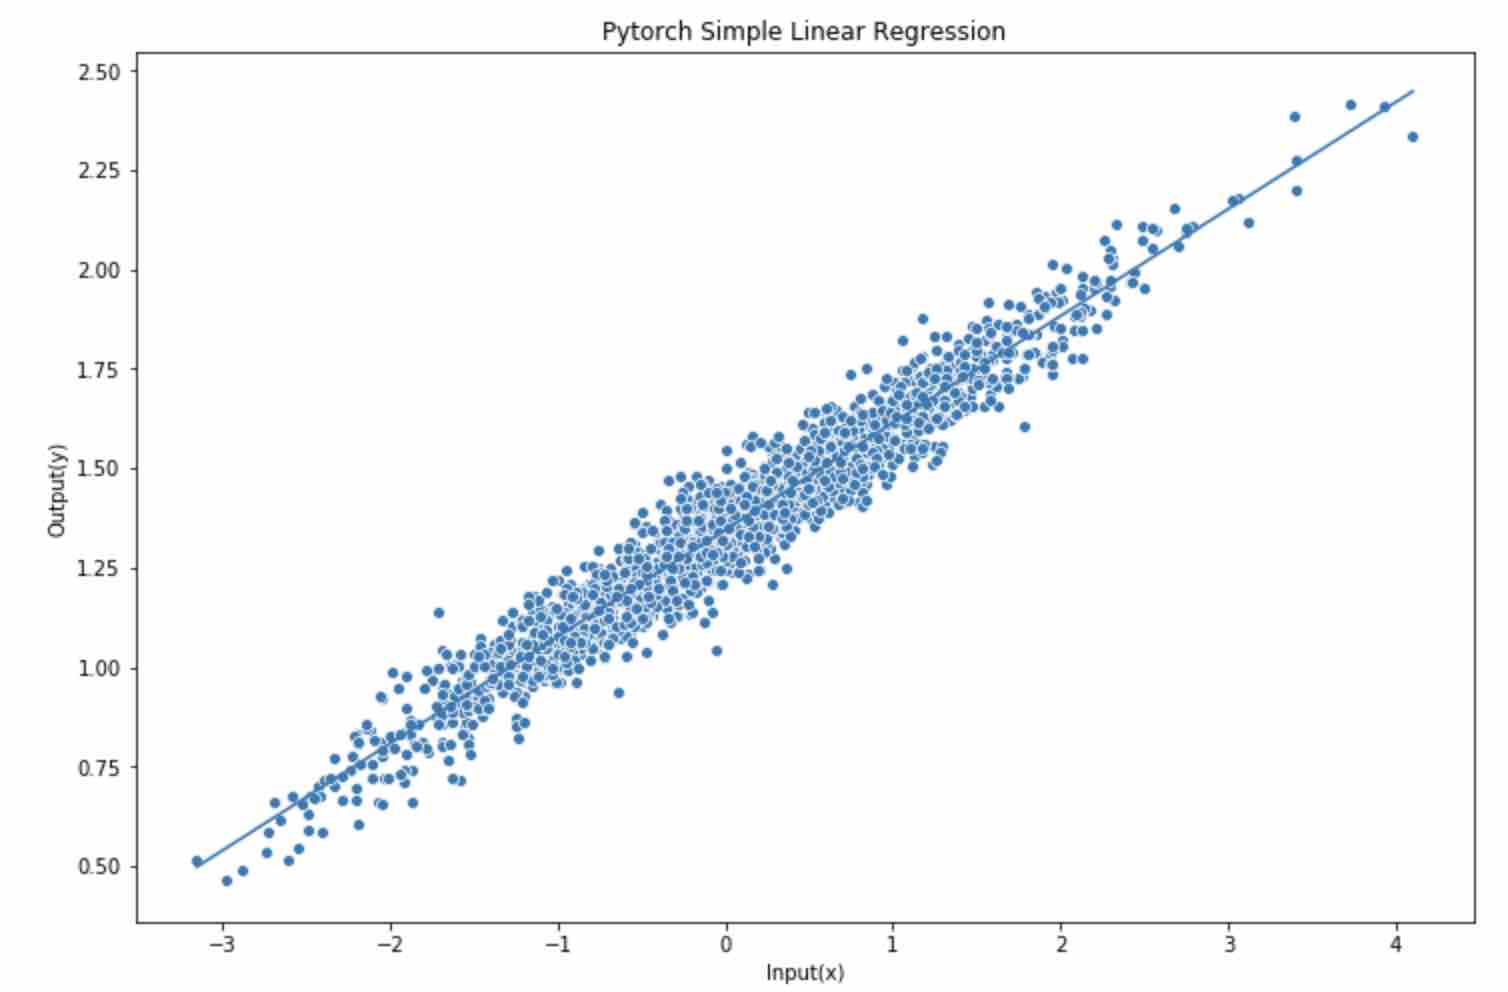
Plot predicted linear function

1
2
3
4
5
6
7
8
9
10
with torch.no_grad():
    y_pred = model(x)

plt.figure(figsize=(12,8))
plt.title('Pytorch Simple Linear Regression')
sns.scatterplot(x=x.numpy()[:,0],y=y.numpy()[:,0])
sns.lineplot(x=x.numpy()[:,0], y=y_pred.numpy()[:,0])
plt.xlabel('Input(x)')
plt.ylabel('Output(y)')
plt.show()

prediction